Business Intelligence
Close More Deals with Data Visualization Software
We are reminded of the power of images when we forgo long status updates in lieu of filtered Instagram photos or share articles comprised of adorable cat photos with little (if any) text. Likewise, images and visual props can highlight key data or visually illustrate an abstract idea; they have the power to convey data quickly, clearly and strongly.
Data visualization software transforms data and numbers into graphs, pie charts and heat maps. These solutions can be used internally to share findings with a team or persuade higher-level executives to move forward with a project, yet they can also be used as outward-facing investor or marketing collateral (as is the case of many infographics).
Data visualization software comes in all shapes and sizes, from small add-ons that work with your current BI software to robust web applications that can turn your raw data into interactive, colorful visuals. Here’s your guide to making data visualization software work for your business.
3 Benefits of Data Visualization Software
Whether you’re a small business or a large enterprise, data visualization solutions will change the way you see data—literally. Here are some of the top benefits your company will achieve:
1. Make Data Make Sense
As we’ve mentioned before, raw data is a lot like a thrift shop: there are true gems hidden within, but it takes searching and sorting to find them. While most BI software organizes data and numbers, data visualization tools can help you sort the data visually, making it easier to spot trends. For instance, viewing online transactions based on mapped geographical locations could show you that all of your customers purchase when they’re next to a certain mall, or at a certain coffee shop. Armed with this information, you could then tweak future marketing efforts to target these places.
This diagram illustrates the difference between textual data and visualized data.
2. Understand Data Faster
Unlike long strings of text and numbers that take time to read, process and understand, imagery imparts a thought, feeling or emotion instantly. Looking at a visual representation of your company’s profits over time, for instance, can instantly provide insights into trends and progress in a way that text and numbers cannot. In a meeting where time is of the essence, a picture can help you cover more information and insights in less time. These time savings are a win-win for both parties.
3. Make A Greater Impact
Want to be remembered at your next corporate meeting? While numbers and text-heavy summaries have their place within your BI strategy, visual storytelling often leaves a bigger impact. In fact, various studies have shown that we react differently to visual stimuli, remembering ten percent of what we hear, twenty percent of what we read and eighty percent of what we see. Therefore even if your BI strategy requires the use of numbers or the written word, the visual components created by data visualization software will help colleagues remember your points more clearly than if you relied on these strategies alone.
Data Visualization Techniques: 4 Practical Applications
Now that you know more about how data visualization tools can benefit your business, it is time to put these solutions to action. Here are four practical ways that you can use a data visualization tool to gain the benefits described above.
Convince Your Boss by Incorporating Visuals into Your Next Presentation
 Looking at the figures below, which grabs your attention more quickly? Since visuals provoke an instantaneous reaction, they are a great asset to any presentation, especially when you’re trying to convince high-level management.
Excel allows users to create small charts, graphs and pivot tables from within its application. With top-notch data visualization software, however, users get complete control over the look and feel of their data and how it is displayed. Many of these solutions even allow users to easily tweak views from within visualizations, making for a smooth, simple user experience.
To make an impact on your boss at your next meeting, find the most interesting data and use your data visualization software to portray it as a hard-hitting image. BI platform Tableau provides various data visualization tools that allow you manipulate and filter what data is displayed to uncover new insights and relationships that would otherwise go unnoticed. With Tableau, data visualization becomes the process by which you can make meaning out of data.
See How Customers Interact with Your Website Using a Heat Map
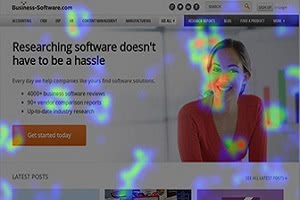 A data visualization tool like Crazy Egg can help your company better understand how customers are interacting with your site using heat maps. These maps take data and information on how customers interact with your site, and generate a map that shows which areas of the site are hot spots, and which aren’t attracting any engagement. A heat map can be a great way to measure whether customers are finding the information they need while on your website. This data visualization software can alert you to potential design issues, improve conversion rates and ensure that your site is fully optimized.
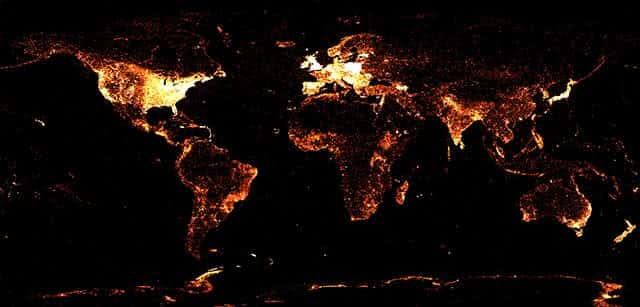
Find Your Customers by Mapping Data
 Data visualization can be an extremely useful tool for learning more about where your customers are located and how their geographical positions may affect (or not affect) your bottom line. On one hand, you could view a string of text and numbers describing the various places where your customers usually originate from. Yet this information becomes significantly more impactful when altered by a data visualization tool.
For instance, your data might tell you that customers are more likely to buy sunscreen online from certain parts of the state. While they may seem like random clusters of active customers, upon mapping the data you may notice that all of these clusters are within a mile of natural lakes. From there, your business could tweak its marketing strategy to reflect these new insights. Using a tool like this, you could tweak your marketing and sales campaigns based on the insights and trends you uncover with location-based data visualization maps.
Share Growth Data With Your Fans In Style
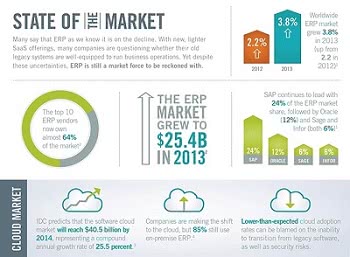 There’s a reason why people love infographics: they’re informative and add value in the shortest possible time, with bright colors and fun graphics to keep readers entertained. This marketing collateral is perfect for sharing internal or external data with your users.
Say that you’ve conducted a study that shows your business has a 96 percent customer satisfaction rate, while two of your competitors only have a 76 percent and 89 percent customer satisfaction rate. While you could release those numbers as is, with a data visualization solution like visua.ly, you could package those numbers into a shareable infographic, along with other company announcements. Infographics are fun for users, and are much more likely to make an impact.
Does My Company Need Data Visualization Software?
Businesses of all shapes and sizes can utilize data visualization software in some form or another. Whether your company wants to incorporate more visuals into business meetings or share new findings with current customers, there is a solution or tool that’s perfect for every budget, need and team. Start your search for the perfect data visualization solution with the Business-Software.com Product Finder, or browse product reviews, top blog posts and premium content on our BI resource center page.
[Image courtesy of Wikimedia Commons]

- Consultant